Documentation
Reading your data
How to read the dashboard, drill into prompts and topics, and understand which sources shape AI answers.
Last updated:
October 20, 2026
Every project has three views of your data: the Dashboard, Prompts, and Citations & Sources. They share the same filters, so you can move between them and keep your context. New to the terms? See the core concepts in Getting started.
The dashboard
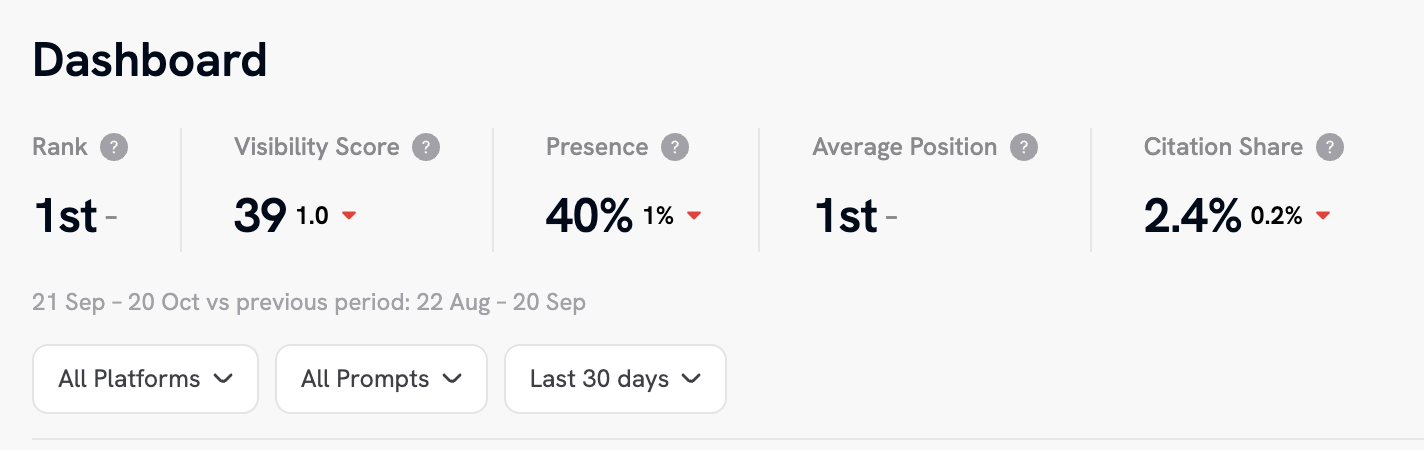
The Dashboard is the summary. The top row shows your Rank, Visibility Score, Presence, Average Position and Citation Share, plus the number of prompts and responses behind them. Each figure shows its change against the previous period of the same length, which is named under the title (for example, the last 30 days against the 30 days before).
Three filters sit above the charts and apply to every figure on the page:
- Platform: all four platforms together, or one at a time
- Prompts: all prompts, Brand prompts only, or Non Brand prompts only
- Date range: the last 30 days by default
Below the summary are the charts:
| Chart | What it answers |
|---|---|
| Visibility over time | Is your visibility rising or falling, and how does that compare with each competitor? |
| Brand ranking | Where do you rank among tracked brands, and who moved? |
| Sentiment | Are mentions of your brand positive, neutral or negative? |
| Citation share over time | How often are your pages cited, and is that growing? |
| Citation share by brand | Which brands do AI platforms cite most? |
| Visibility by platform | Do ChatGPT, Perplexity, Claude and Google AI Overviews treat you differently? |
Tip: start with Non Brand prompts. They show whether you are discovered by people who don't know you. Then switch to Brand prompts to see how AI describes you once they do.
Prompts and topics
Open Prompts to see performance by topic and by individual prompt. The filters here add two more: Sentiment and Competitor, so you can isolate, for example, only the prompts where one rival is mentioned. To change which prompts and topics are tracked, see Setting up your tracking.
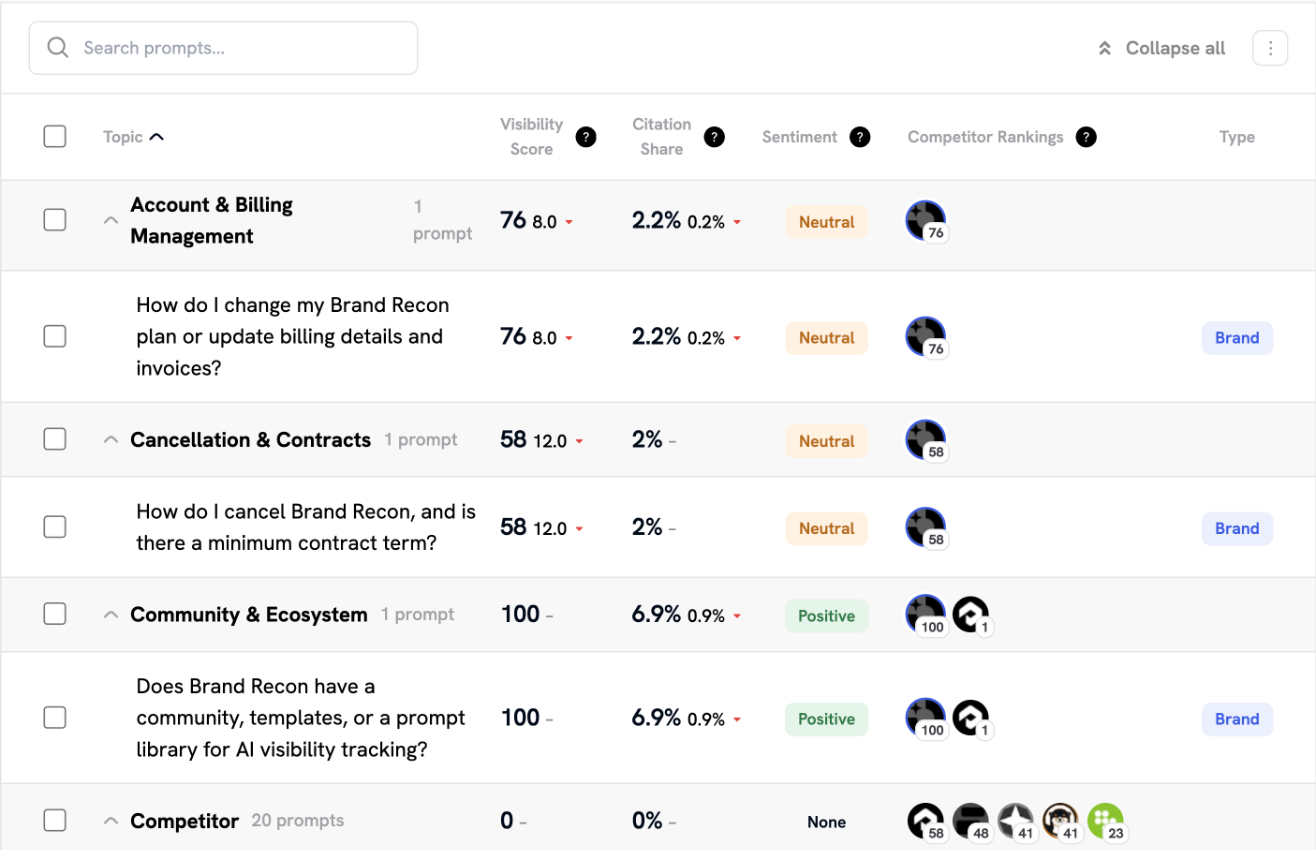
The table groups prompts under their topic. Expand a topic to see its prompts, or use Collapse all. Each row shows:
- Visibility Score and its change
- Citation Share and its change
- Sentiment
- Competitor Rankings, showing how the tracked brands compare
- Type, Brand or Non Brand
Two patterns are worth looking for. A topic with a high score and positive sentiment is a strength to protect. A topic with a score of zero, especially in comparison or category prompts, is where competitors are being recommended instead of you.
Citations and sources
Open Citations & Sources to see which web pages shape AI answers, not just whether you are mentioned. This view has its own filter that switches between citations and sources:
- A citation is a page the answer links to directly.
- A source is a page the platform used to build the answer without linking to it.
The page shows:
- Rank and Share: your citation share and where it ranks against competitors
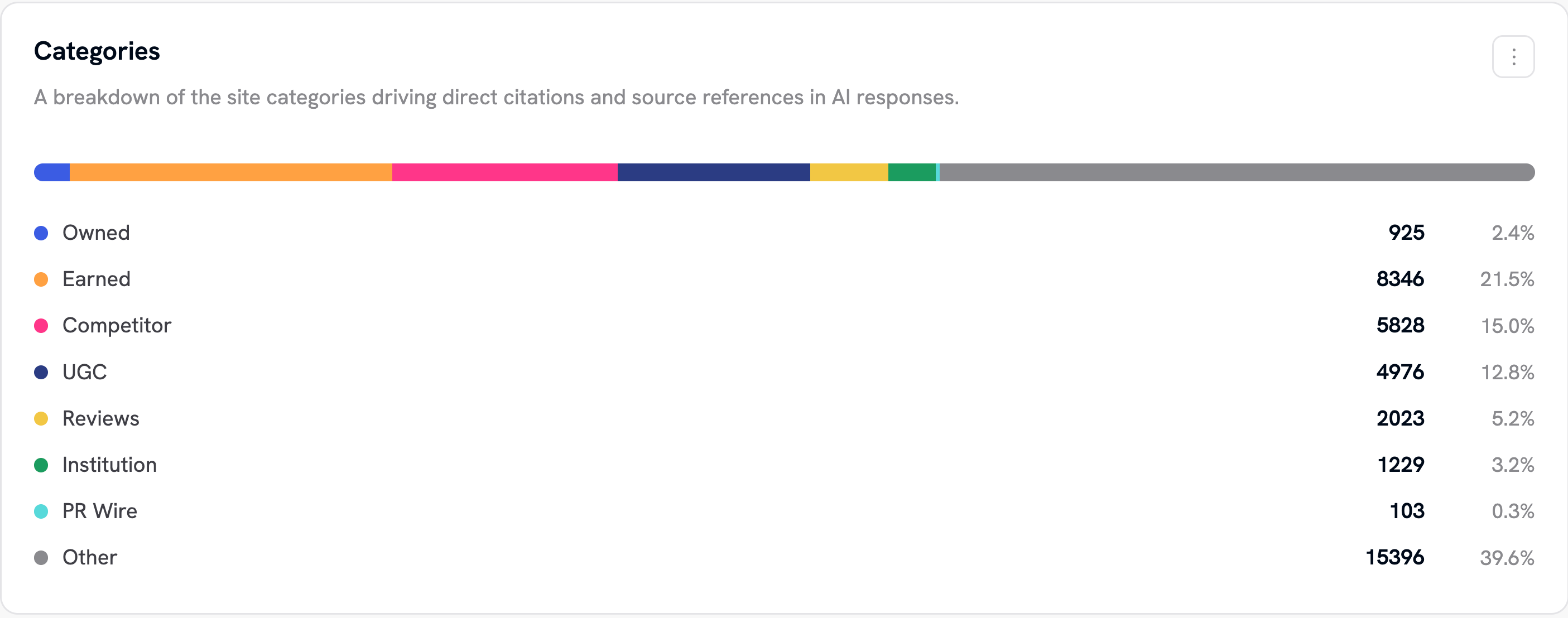
- Categories: a breakdown of cited domains by type: Owned, Earned, Competitor, UGC (user-generated content), Reviews, Institution, PR Wire and Other
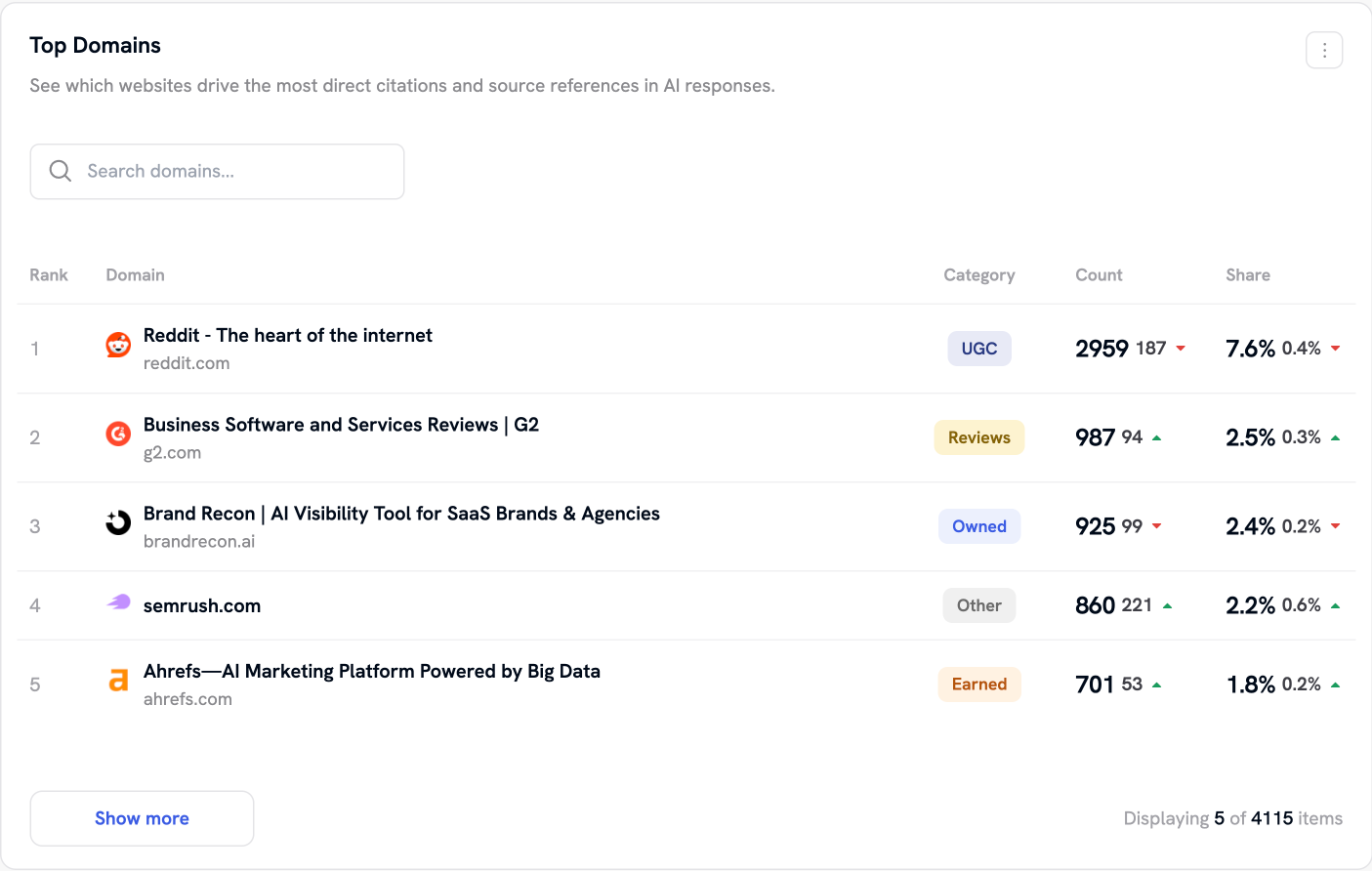
- Top Domains: the websites cited most often, with their category, count and share
- Top Pages: the individual pages cited most, with their category, whether they are Owned or Organic, and whether your brand was Mentioned in the responses that cited it
Top Pages is the most actionable table. A frequently cited page marked Not Mentioned is a gap: it shapes answers that leave you out, and the list shows which pages and publishers to approach. Taking action shows how to turn these gaps into a content and outreach plan.
Exporting. You can export any chart as a JPEG and almost every table as a CSV, which is useful for reports and client updates. You can also ask an AI assistant to analyse the same data through the MCP connector.